🐍 Practice n°1: data engineering (students version)
The objective of this session is to learn about the basics of data engineering. You will have to explore the Ratebeer dataset using sql and python.
This dataset consists of beer reviews from ratebeer. The data span a period of more than 10 years, including all ~3 million reviews up to November 2011. Each review includes ratings in terms of five "aspects": appearance, aroma, palate, taste, and overall impression. Reviews include product and user information, followed by each of these five ratings, and a plaintext review. We also have reviews from beeradvocate.
source ratebeer dataset description
To avoid high compute time, we are going to work with a sample during the session. Also, the data is already cleaned.
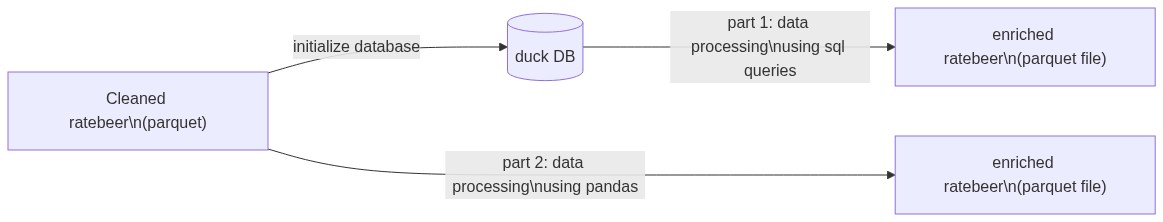
Here are the main steps of the notebook :
- Preparation
- Data engineering in sql with duckdb
- Data engineering in python with pandas
This is a data engineering tutorial in Python/pandas, it assumes you have already some some knowledge of data engineering in SQL.
Preparation
Install & import modules
!pip install pyarrow
import pandas as pd

pd.set_option("display.max_columns", 100)
Preparation
Get some doc
Read data
The data is in this git repository: ML-boot-camp/ratebeer.git.
The data is located in the ratebeer/data/ folder.
file_url = "https://github.com/ML-boot-camp/ratebeer/raw/master/data/ratebeer_sample_clean.parquet"
Load the file ratebeer_sample_clean.parquet to extract a pandas DataFrame and
assign
it the variable df_raw.
Hint:
df_raw = pd.read_parquet(file_url)
df_raw.shape
Overview
Get a few information about the content of the dataframe:
- number of null values per column
- data type of each column
- memory usage
Methods you'll need:
df_raw.isnull().sum()
df_raw.dtypes
*** FILL THE MISSING LINE ***
df_raw.head(5)
Describing statistics
Compute statistics to understand the content of each column.
Methods you'll need:
Bonus: fill NaN values with an empty string "" for a better readability using:
df_raw.describe(include="all").fillna("")
Sometimes you only need the describing statistics for a single column. Count and display the distinct beer names.
Hint:
*** FILL THE MISSING LINE ***
*** FILL THE MISSING LINE ***
*** FILL THE MISSING LINE ***
Select data
Create the following dataframe :
- Keep only those columns:
beeralcoholtypeuserrating
- Keep only rows for which the
typecolumn contains the string"Stout"
Hint:
selected_columns = [
    "beer",
    "alcohol",
    "type",
    "user",
    "rating",
]

df_stout = (
    (df_raw)
    .loc[:, selected_columns]
    *** FILL THE MISSING LINE ***
    .reset_index(drop=True)
)
df_stout
Compute the number of occurences of each Stout beers.
df_stout.type.value_counts()
Feature engineering
High cardinality variables
beerbreweryuser
All those high cardinality variables can be thought as links of a network. Indeed, a review is an object comprising a beer, a brewery and a user and can be thought as a network link between them.
In other words, the review table is the a table describing the links in a network with 3 types of nodes: users, beers and breweries.
The first property to compute about each node is its "degree", which is its number of connections with other nodes. High degree means "highly connected".
To compute the degree you'll need:
df_beer_degree = (
    (df_raw.beer)
    *** FILL THE MISSING LINE ***
    .rename("beer_degree")
    .reset_index()
)
df_beer_degree
Check that this table will merge properly.
df_tmp = df_raw.merge(
    df_beer_degree,
    on="beer",
    how="outer",
    validate="m:1",
    indicator=True,
)
df_tmp._merge.value_counts()
df_brewery_degree = (
    (df_raw.brewery)
    *** FILL THE MISSING LINE ***
    .rename("brewery_degree")
    .reset_index()
)
df_brewery_degree
Check that this table will merge properly.
df_tmp = df_raw.merge(
    df_brewery_degree,
    on="brewery",
    how="outer",
    validate="m:1",
    indicator=True,
)
df_tmp._merge.value_counts()
df_user_degree = (
    (df_raw.user)
    *** FILL THE MISSING LINE ***
    .rename("user_degree")
    .reset_index()
)
df_user_degree
Check that this table will merge properly.
df_tmp = df_raw.merge(
    df_user_degree,
    on="user",
    how="outer",
    validate="m:1",
    indicator=True,
)
df_tmp._merge.value_counts()
We'll then merge the 3 dataframe at once.
text_length = df_raw.text.str.len()
text_length
Convert timestamp
date = (df_raw.timestamp).astype(int).apply(pd.Timestamp.fromtimestamp)
date
Binary target
The prediction problem is to predict rating based on other information. Since
rating is a numeric variable, it is a regression problem. We'd like also to do a
classification so we'll create a binary target based on the rating.
The ìs_good column is True if the rating is above or equal to 16 (expert judgement),
False otherwise.
Note: also convert the binary target to integer (O or 1) for better readability.
Methods you'll need:
is_good = (df_raw.rating >= 16).astype(int)
is_good
What are the values of this binary target ?
is_good.value_counts()
Combine dataframes
Create a dataframe combining information from:
df_raw: the original datasetdf_beer_degree: merged onbeercolumndf_brewery_degree: merged onbrewerycolumndf_user_degree: merged onusercolumntext_length: added as a new columndate: added as a new columnis_good: added as a new column
Note: merge is the equivalent of JOIN in SQL, and it changes the order of the rows
! So to add our data columns properly in the dataset, we have 2 options:
- add the new columns using precomputed arrays, but before merging (not recommended):
e.g:
df_raw.text.str.len() - add the new columns using a function (recommended):
e.g:
lambda df: df.text.str.len()
Hint:
Note: If some columns in both the left & right dataframes have the same name, you'll
obtain duplicated columns in the merge result. pandas adds the suffixes _x
and _y to avoid creating duplicate columns.
Use the suffixes argument to specify the suffixes to apply to duplicated
columns. In this example, there is no common column name in both dataframes.
We made lots of transformation to our datasets: we want to verify that all
values in the "primary keys" columns are indeed unique. Use the validate
argument to do so.
df_main = (
    (df_raw)
    .merge(
        df_beer_degree,
        *** FILL THE MISSING LINE ***
        how="inner",
        validate="m:1",
    )
    .merge(
        df_brewery_degree,
        *** FILL THE MISSING LINE ***
        how="inner",
        validate="m:1",
    )
    .merge(
        df_user_degree,
        *** FILL THE MISSING LINE ***
        how="inner",
        validate="m:1",
    )
    .assign(text_length=lambda df: df.text.str.len())
    .assign(
        date=lambda df: (df.timestamp).astype(int).apply(pd.Timestamp.fromtimestamp)
    )
    .assign(is_good=lambda df: (df.rating >= 16).astype(int))
)
df_main
Save the final result to a parquet file named ratebeer_sample_enriched.parquet.
Hint:
# Uncomment the line below to save the dataset to disk
df_main.to_parquet("ratebeer_sample_enriched.parquet")
GOOD JOB 👍