Data format
You should be able to reshape your data according to your need. Should you use wide format or long format or none of them ?
Let's find out.
Formats
We describe below 4 types of format for data: raw, long, compact, wide.
Note
The term Compact has been defined only in the context of this course. Also the Long, Wide and Raw terms have no standardized definition in the industry. Don't use those terms as if it's something widely known in the data engineering community.

Raw
In its raw form, data is usually made of payloads containing keys and values (i.e. dictionaries).
Example when receiving payload of meteorological data with temperature and humidity (integrated sensor):
[
  {
    "Date": "2023-01-01",
    "City": "CityA",
    "Temperature": 20,
    "Humidity": "30%"
  },
  {
    "Date": "2023-01-01",
    "City": "CityB",
    "Temperature": 15,
    "Humidity": "25%"
  },
  {
    "Date": "2023-01-01",
    "City": "CityC",
    "Temperature": 18,
    "Humidity": "28%"
  },
  {
    "Date": "2023-01-02",
    "City": "CityA",
    "Temperature": 21,
    "Humidity": "31%"
  },
  {
    "Date": "2023-01-02",
    "City": "CityB",
    "Temperature": 16,
    "Humidity": "26%"
  },
  {
    "Date": "2023-01-02",
    "City": "CityC",
    "Temperature": 19,
    "Humidity": "29%"
  }
]
Or alternatively when receiving payloads of meteorological data with either temperature or humidity (different sensors):
[
  { "Date": "2023-01-01", "City": "CityA", "Temperature": 20 },
  { "Date": "2023-01-01", "City": "CityA", "Humidity": "30%" },
  { "Date": "2023-01-01", "City": "CityB", "Temperature": 15 },
  { "Date": "2023-01-01", "City": "CityB", "Humidity": "25%" },
  { "Date": "2023-01-01", "City": "CityC", "Temperature": 18 },
  { "Date": "2023-01-01", "City": "CityC", "Humidity": "28%" },
  { "Date": "2023-01-02", "City": "CityA", "Temperature": 21 },
  { "Date": "2023-01-02", "City": "CityA", "Humidity": "31%" },
  { "Date": "2023-01-02", "City": "CityB", "Temperature": 16 },
  { "Date": "2023-01-02", "City": "CityB", "Humidity": "26%" },
  { "Date": "2023-01-02", "City": "CityC", "Temperature": 19 },
  { "Date": "2023-01-02", "City": "CityC", "Humidity": "29%" }
]
Each record is dictionary made of variables which can be:
- categories: used to select and filter data or link to other table. Usually a string or an integer.
- values: an actual measurement of a sensor. Usually a float.
Long
The easiest way to store the data in the long format using only 3 columns:
- an ID of the measurement
- the variable name
- the variable value
The long format would look like this:
| ID | Variable | Value |
|---|---|---|
| 1 | Date | 2023-01-01 |
| 1 | City | CityA |
| 1 | Temperature | 20 |
| 1 | Humidity | 30% |
| 2 | Date | 2023-01-01 |
| 2 | City | CityB |
| 2 | Temperature | 15 |
| 2 | Humidity | 25% |
| 3 | Date | 2023-01-01 |
| 3 | City | CityC |
| 3 | Temperature | 18 |
| 3 | Humidity | 28% |
| 4 | Date | 2023-01-02 |
| 4 | City | CityA |
| 4 | Temperature | 21 |
| 4 | Humidity | 31% |
| 5 | Date | 2023-01-02 |
| 5 | City | CityB |
| 5 | Temperature | 16 |
| 5 | Humidity | 26% |
In this representation, the integer ID serves to group the related values for each observation, while the variable column specifies the type of information, and the value column contains the actual data.
This format is best suited for storage:
- it is extremely flexible, as we can add more variables for each measurement without changing the table schema
- it has a better storage efficiency when working with sparse data.
But it can become more complex to work with, particularly for data analysis tasks.
Compact
Usually the best format for your data is neither fully wide nor fully long. The purpose of those "extreme" format examples is to show that data can (and should) be reshaped depending on the use case.
The best practice for data engineering is to format your data to have 1 column per variable. This implies:
- not wide format: don't use variables in column names
- not long format: don't mix different variables in the same column
The compact format applied to our meteorological data example looks like this:
| Date | City | Temperature | Humidity |
|---|---|---|---|
| 2023-01-01 | CityA | 20 | 30% |
| 2023-01-01 | CityB | 15 | 25% |
| 2023-01-01 | CityC | 18 | 28% |
| 2023-01-02 | CityA | 21 | 31% |
| 2023-01-02 | CityB | 16 | 26% |
| 2023-01-02 | CityC | 19 | 29% |
It naturally aligns with the structure of the data: each row represents a single observation (in a city on a particular date), and each variable (temperature and humidity) has its column.
The compact format is best suited for data engineering:
- to filter and select the data for various criteria
- to transform variables (scaling, outliers management)
- to compute new variables (e.g: wet bulb temperature from temperature & humidity)
It's not very readable but is very convenient to work with.
Wide
The wide format uses the categories to create the columns, it displays only values for a given index (on the left).
Here is how the meteorological would look in the wide format:
| Date | Temperature_CityA | Humidity_CityA | Temperature_CityB | Humidity_CityB | Temperature_CityC | Humidity_CityC |
|---|---|---|---|---|---|---|
| 2023-01-01 | 20 | 30% | 15 | 25% | 18 | 28% |
| 2023-01-02 | 21 | 31% | 16 | 26% | 19 | 29% |
This is not very readable and usually the only reasonable use of wide format is to display data for a particular use-case:
- select a single category for the index (e.g: year)
- select a single category for the columns (e.g: city)
- select a single value to fill the cells (e.g: temperature)
So, if we'd like to compare temperatures in various cities:
| Date | Temperature_CityA | Temperature_CityB | Temperature_CityC |
|---|---|---|---|
| 2023-01-01 | 20 | 15 | 18 |
| 2023-01-02 | 21 | 16 | 19 |
The wide format is best suited for visualization.
Summary
| Format | Description | Best Suited For | Example Characteristics |
|---|---|---|---|
| Raw | Dictionaries containing keys and values (e.g., JSON). | Initial data storage | Separate dictionaries for each record |
| Long | 3 columns: ID, variable, value. | Storage (sparse data & flexible schema) | Each variable is a separate row |
| Compact | 1 column per variable. | Data engineering | Each row represents a single observation |
| Wide | Categories define columns to spread a variable. | Visualization | Column names include categories, like Temperature_CityA |
Reshaping data format
A good data scientist/analyst/engineer should be able to easily reshape and reformat data from one format to another, depending on the need.
Let's see how to do this in python.
Note
The transformation are described below as Long -> Wide (or Wide -> Long), but depending on the number variables transformed from rows to columns (or from columns to rows), this could be seen as a (not full) transformation like Long -> Compact and Compact -> Wide (or Wide -> Compact and Compact -> Long).
Note
This section is a subset of the excellent article "Reshaping and pivoting tables" from the pandas documentation. It is highly recommended to check it out.
Long -> Wide
This operation aims at transferring some data from columns to rows. It takes:
- 1+ variable(s) to define an index (i.e. the rows)
- 1+ variable(s) to create columns
- 1 variable to fill the created cells.
To do this, there are 2 functions available in pandas:
pivot
and
pivot_table
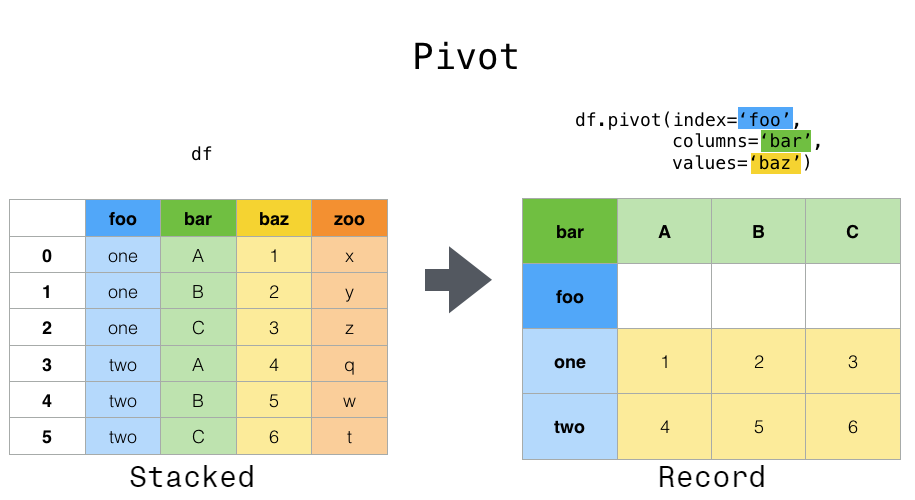
In
pivot,
the variables used to define the index and the columns should define a unique value
per cell of the dataframe. In other words, those index & columns variables should be
a primary key of the input (long) dataframe
Whereas
pivot_table
is able to handle multiple values per cell and to aggregate them, using the argument
aggfunc (for aggregation function such as: sum, mean, min, max, count, and so on).
You can even use external aggregation functions:
- such as the numpy statistics
- or the scipy statistics
- or even your own code.
In fact, this aggregation capability is its main purpose: pivot_table is a convenient
alternative to the use of the groupby & agg methods.
Wide -> Long
This operation aims at transferring some data from rows to columns. It takes 1+
variable(s) to be kept as index and uses the remaining variables to be put in 2 columns
(usually named variable and value).
To do this, there are 2 functions available in pandas:
melt and
wide_to_long
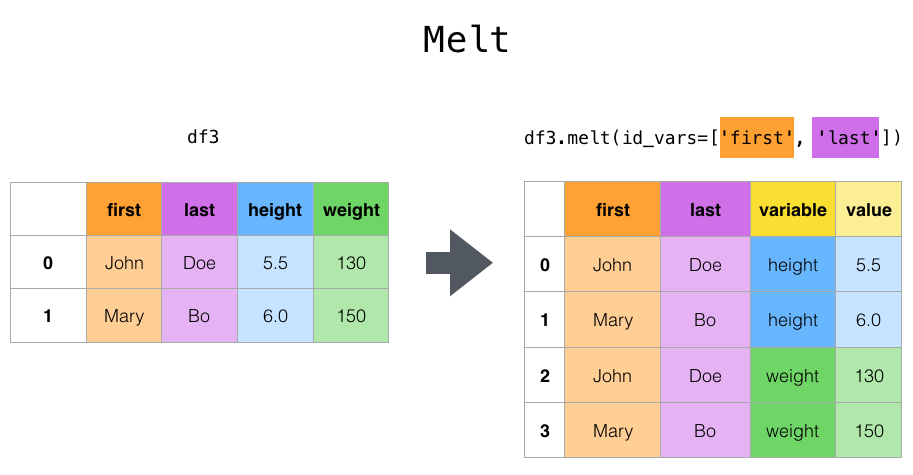
The melt
function basically lets you specify the column to be kept as index.
Whereas the
wide_to_long
function, even if it uses melt under the hood, is helpful if you need to extract
categorical values from the column names using a regex pattern, rather than using the
full column name.
Summary
| Transformation | Direction | Functions |
|---|---|---|
| Long -> Wide | Columns to Rows | pivot: Requires unique value per cell.pivot_table: Aggregates multiple values per cell. |
| Wide -> Long | Rows to Columns | melt: Only specifies index column.wide_to_long: Extracts categorical values using regex. |